
Leaving aside that Goldman got in trouble for preparing for trouble in the aftermath of Sandy, the firm reported strong quarterly results. 850+ billion in investment management assets, over $8 billion in net revenues, with over $4 billion in institutional client services revenues.

The Goldman Sachs Group reported net revenues of $8.4 billion and net earnings of $1.5 billion for the third quarter. GS ranked first in worldwide announced and completed M&A year-to-date, as well as in worldwide equity and equity-related offerings. Goldman’s global core excess liquidity was $170 billion as of September 30, 2012; its Tier 1 capital ratio under Basel 1 was 15%, Tier 1 common ratio was 13.1%.

Net revenues in Investment Banking were $1.2 billion, 49% higher than last year, but 3% lower than last quarter. Financial Advisory stood at $0.5 billion, slightly lower compared to Q3 2011. Underwriting, however, more than doubled year on year to $0.7 billion, due to higher net revenues from leveraged finance activity.
Net revenues in Institutional Client Services were $4.2 billion, 3% higher than the third quarter of 2011 and 8% higher than the second quarter of 2012. Fixed Income, Currency and Commodities Client Execution brought in $2.2 billion, almost a third more than last year, with strong gains for mortgages and higher net revenues in credit products, currencies and interest rate products, partially offset by significantly lower net revenues in commodities. During the third quarter of 2012, Fixed Income, Currency and Commodities Client Execution operated in an environment generally characterized by tighter credit spreads, as certain central banks took steps to ease monetary policy; however, broad market concerns persisted and levels of activity generally remained low.
Net revenues in Equities was $2 billion, 16% lower than last year, primarily due to significantly lower commissions and fees, reflecting lower market volumes, and lower net revenues in equities client execution. In addition, net revenues in securities services were slightly lower compared with the third quarter of 2011, reflecting the impact of lower average customer balances.
During the quarter, Equities operated in an environment generally characterized by an increase in global equity prices and lower volatility levels.
Net revenues in Investment Management were $1.2 billion, 2% lower than Q3/2011 and 10% lower quarter on quarter. The decrease in net revenues compared with the third quarter of 2011 reflected lower transaction revenues and slightly lower management and other fees, partially offset by higher incentive fees.
During the quarter, assets under management increased $20 billion to $856 billion, reflecting net market appreciation.
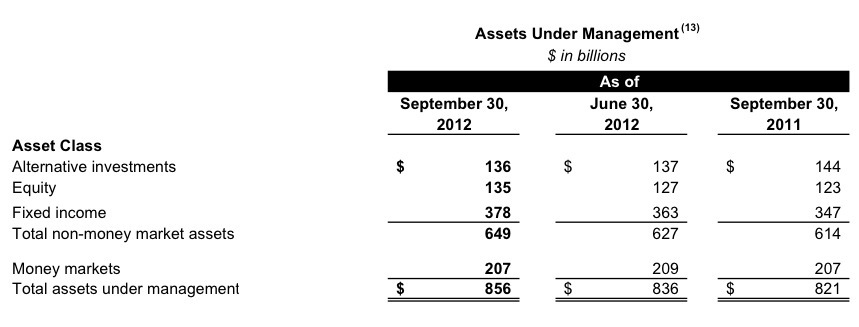
Let’s take a closer look at the composition of the $850+ billion in AUM: not surprisingly, fixed income assets are now the largest asset class, with $380 billion. Notably, alternative assets ever so slightly surpassed equities, $136 billion vs. $135 billion, a reflection of the increasing focus for institutional clients on alternative solutions.
I invite you to follow me on twitter @danenskat
(c) Enskat Associates 2012
